A 10-Point Food Cost Improvement
on the Signature Item of a $2M Restaurant.
How Foodi helped a $2M restaurant identify and address food-cost opportunities that had a meaningful impact on the economics of the business.
Annual restaurant revenue
Brisket plate cost — a 10 percentage-point improvement
Yield variance between shifts
Verified engagement metrics. The 40% → 30% figure is a 10 percentage-point reduction in the plate cost of the restaurant's highest-cost item — not a change in total food cost across the menu. Foodi does not publish extrapolated dollar savings that the underlying data does not support.
Small percentages create big dollars in restaurants.
At $2M in annual revenue, a single point of food cost is roughly $20,000 of sales dollars a year. That is why an operator cannot afford to carry cost drift on their highest-volume items — and why the difference between a 40% plate and a 30% plate is not a rounding error.
1 point of food cost on $2M in annual sales
2 points of food cost on $2M in annual sales
5 points of food cost on $2M in annual sales
Illustrative calculation based on reported revenue only. It shows what a point of food cost is worth at $2M in sales — it is not a statement of this restaurant's realized savings. Actual financial impact depends on the restaurant's underlying food-cost structure, menu mix, and other operating factors.
The restaurant had the data. It didn't have a consistent operating system for turning that data into action.
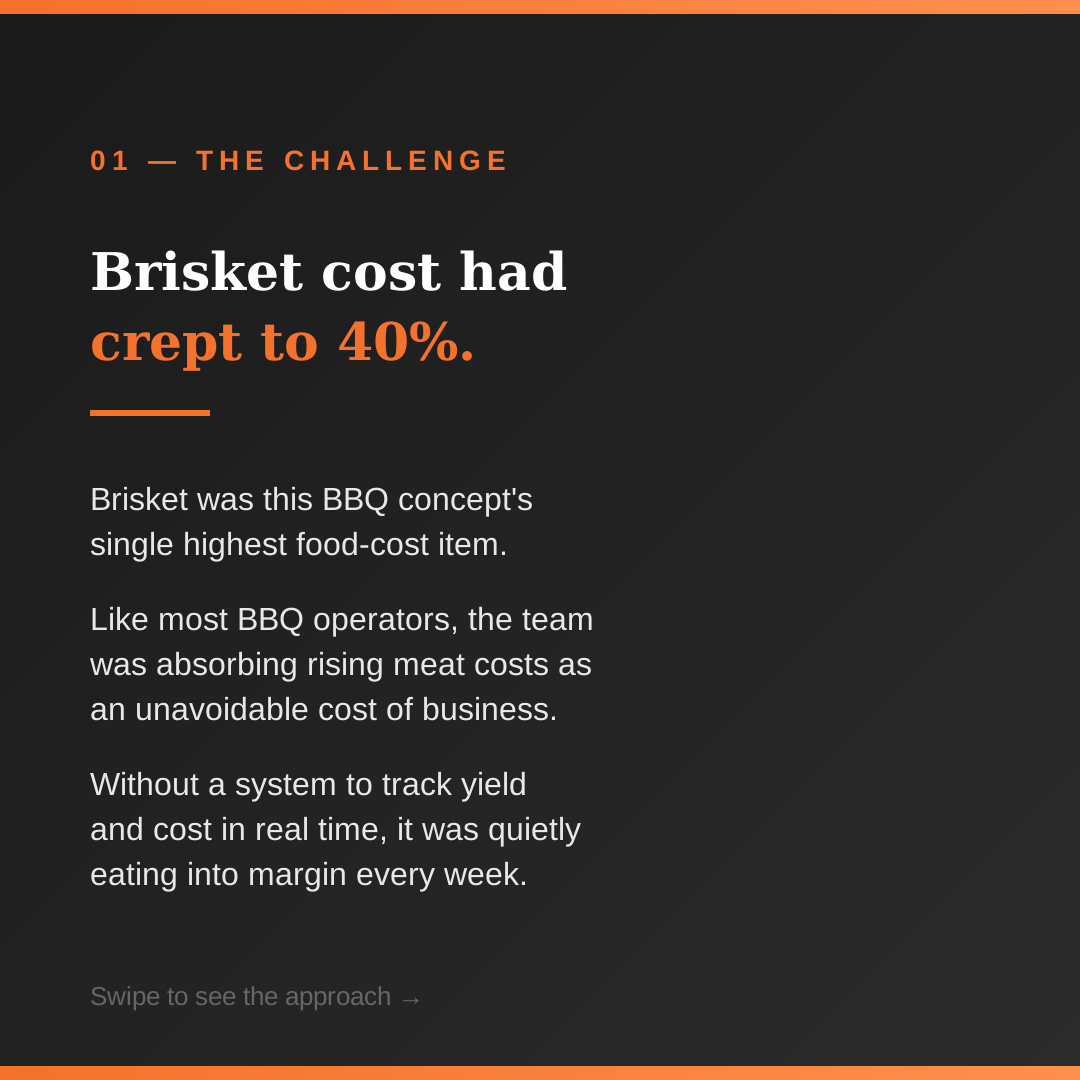
A fast-growing BBQ concept in Houston was losing margin on its signature protein. The pitmaster was excellent. The numbers were invisible.
No live read on what a plate actually cost. Vendor increases surfaced at month-end, on a P&L that was already 30 days old.
Brisket, rub, and sides were never costed in the POS. The most expensive item on the menu was priced on instinct.
Trim loss and cook loss swung ±12% between shifts. The same cut produced a different plate cost depending on who worked it.
Protein pricing moved without anyone catching it. There was no purchase history being used at the negotiating table.
No weekly cadence tied a manager to a number. Cost review happened quarterly, if at all.
Before Foodi
Annual revenue
Brisket plate cost — the highest-cost item on the menu
Yield variance, shift to shift
Live price visibility — vendor hikes caught at month-end
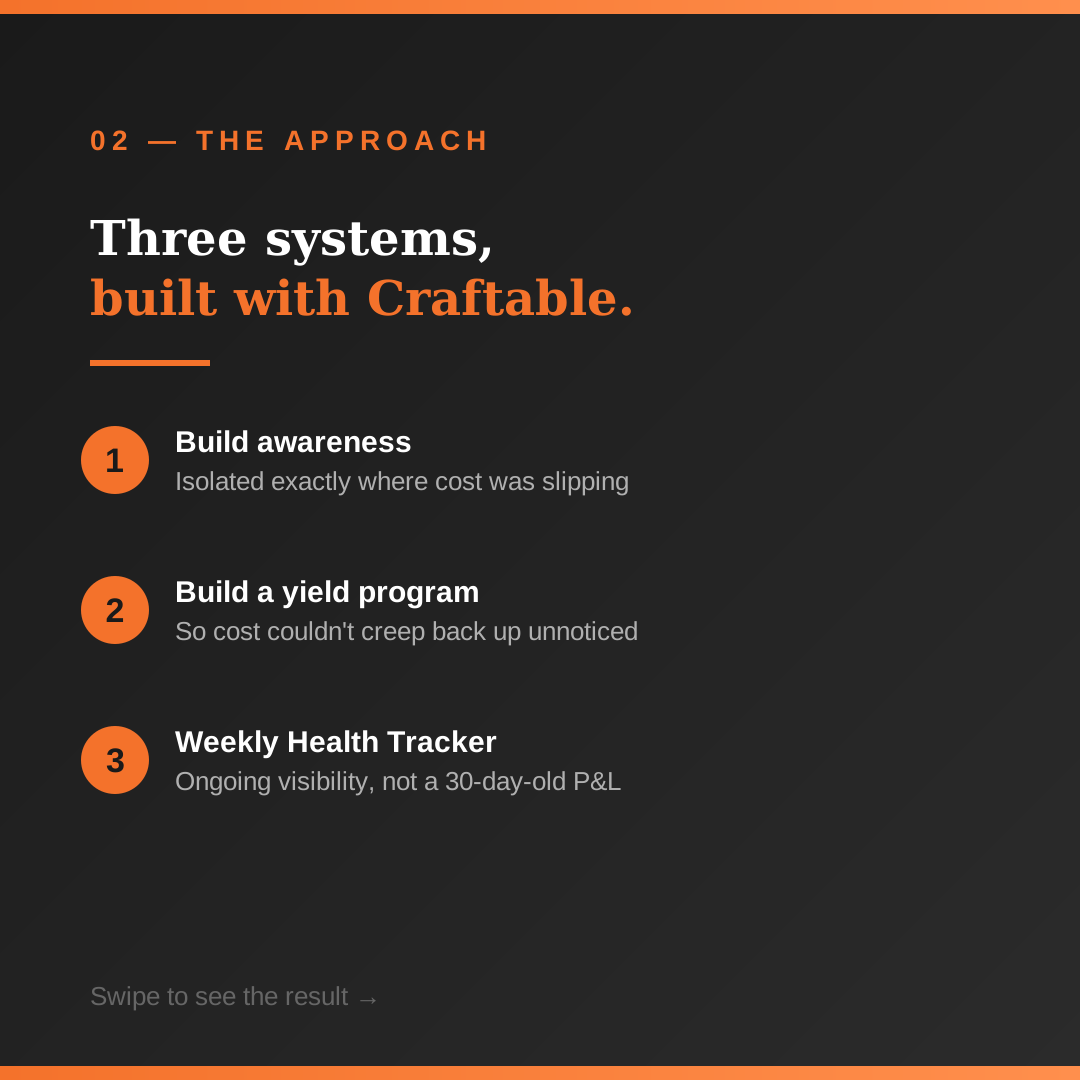
Find → Identify → Prioritize → Act → Measure
Establish visibility into true food-cost performance
Foodi built the full recipe tree for brisket, rub, and sides inside Craftable, mapping every vendor item down to the plate. For the first time the restaurant could see what a portion actually cost — not what it was assumed to cost.
Isolate the operational drivers behind the variance
The drivers were specific and measurable: trim and cook loss swinging ±12% between shifts, and vendor protein pricing moving without detection. Brisket — the single highest-cost item — carried most of the exposure.
Focus on the changes with the largest financial impact
Rather than reworking the whole menu, the work concentrated on the item with the most dollars behind it: brisket yield discipline, and the primary protein vendor agreement backed by 90 days of purchase data.
The team implemented the operating changes
A weekly count cadence on trim yield and cook loss, recorded every Monday before the rush. A renegotiated primary vendor agreement plus a secondary supplier for lean trim, locking in better tier pricing.
Track the result and make the rhythm repeatable
Menu re-costing moved from quarterly to weekly. When market price on brisket moves, margin now moves with it. A Weekly Health Tracker replaced the 30-day-old P&L as the operating instrument.
The number that mattered: 10 points.
Ten points looks small on a percentage chart. On the plate that drives the most volume in a $2M restaurant, it changes the economics of the menu — and every point of food cost at $2M in sales is roughly $20,000 a year.
Verified engagement result, achieved in 10 weeks. The $20,000-per-point figure is an illustrative calculation on $2M of revenue, not a reported savings figure for this restaurant.
The result wasn't another report. It was a better operating number.
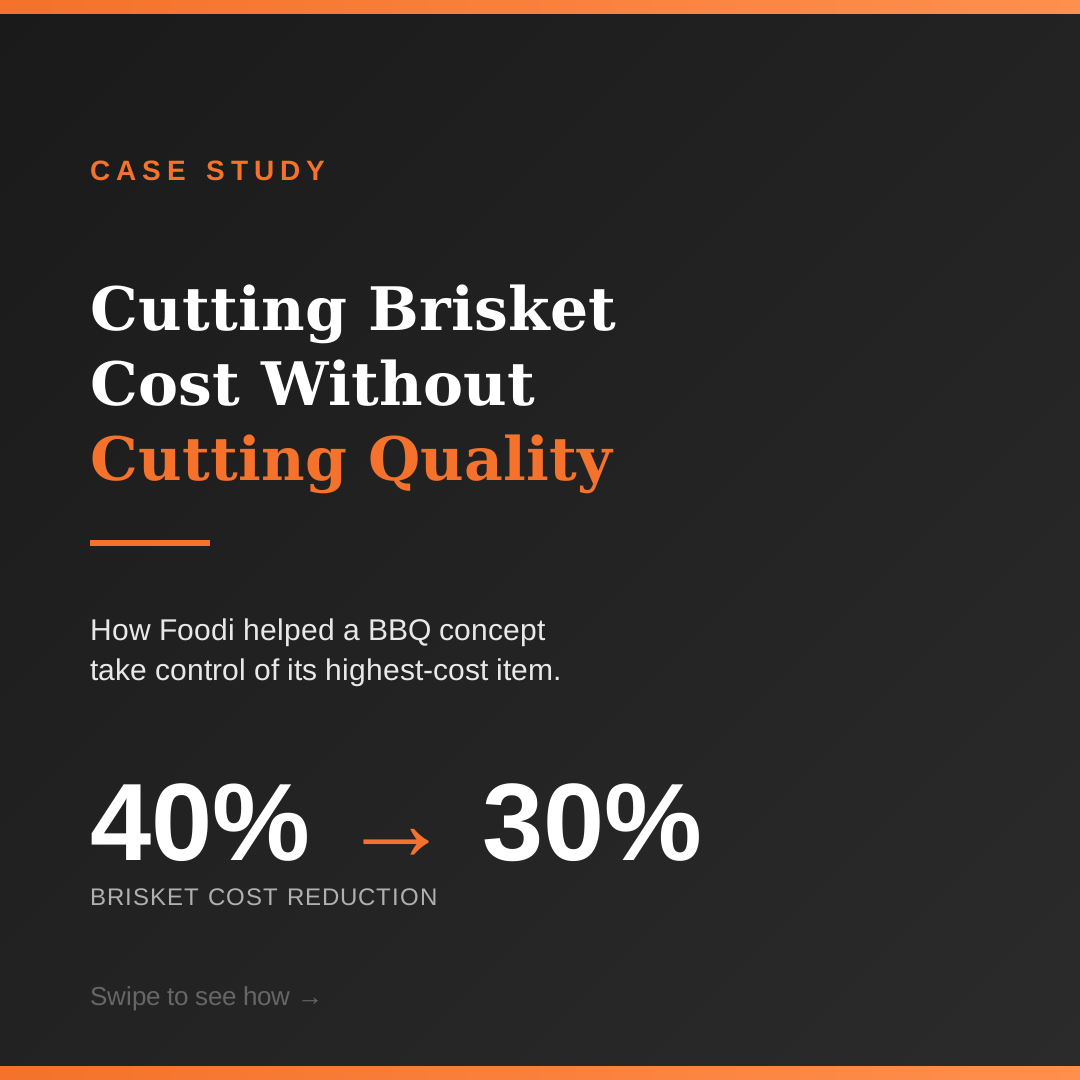
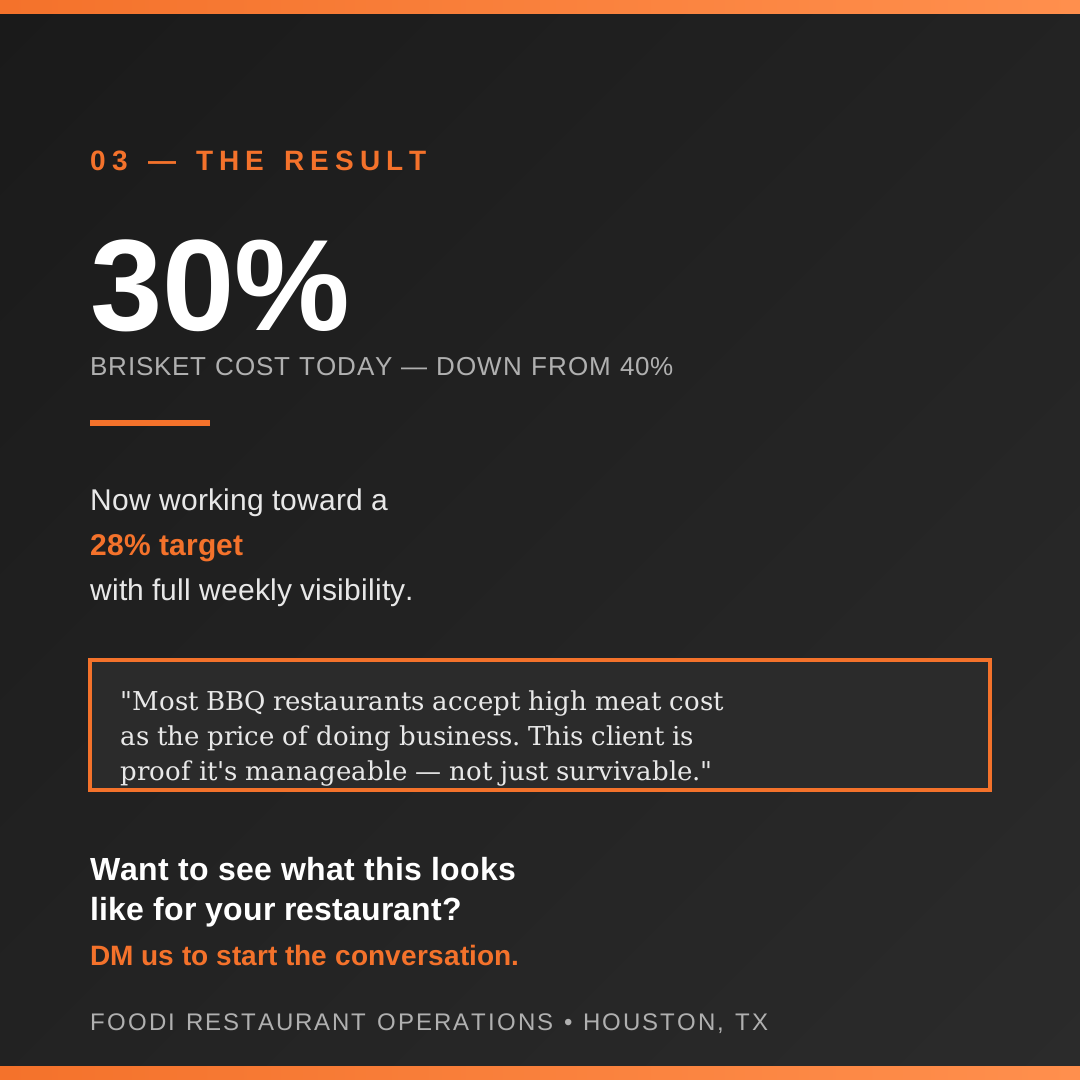
Improvement in brisket plate cost — 40% to 30% — achieved in 10 weeks through yield and vendor discipline.
Annual revenue
Yield variance after — down from ±12%
Next target, in progress via portion spec and rub batch-costing
Time to spot a vendor price jump — previously month-end
Re-costing cadence — previously quarterly
Time to result
Before Foodi → After Foodi
Restaurant operators don't run their business in percentages. They run it in dollars.
An improvement in food cost isn't just a better-looking KPI. It changes how much money the restaurant keeps from every dollar of sales.
Annual revenue
Improvement in brisket plate cost — verified
Illustrative annual sales-dollar value of one point of food cost at $2M
For a $2M restaurant, a few percentage points can represent six figures.
Illustrative calculation. The verified 10-point improvement applies to the plate cost of one item, so it cannot be multiplied directly against total revenue. Foodi reports what the data supports and labels every extrapolation as an illustration rather than a realized saving.
Foodi didn't just measure the problem. Foodi helped build the operating discipline to fix it.
Foodi worked with the restaurant team to establish the systems, visibility, and operating discipline needed to improve food-cost performance — then made that rhythm repeatable so the number couldn't quietly creep back.
Every vendor item mapped to the plate inside Craftable.
A Monday count that ties a manager to a number before the rush.
Yield and portion discipline that survives a shift change.
Re-costing every week instead of every quarter.
Work aimed at the item carrying the most dollars.
A cost number that moves, and stays moved.
The lesson isn't that every restaurant will find ten points.
The lesson is that percentage points matter. In a $2M restaurant, a single point of food cost is roughly $20,000 of annual sales dollars — so a handful of points on the items that drive volume can reach six figures. The opportunity in your restaurant depends on your current food cost, revenue, purchasing, menu mix, labor model, and operating discipline.
Foodi's job is to find out where your opportunity is.
Swipe through the case study
What's hiding inside your
restaurant's numbers?
Foodi helps restaurant operators find the operational issues that are costing them money, prioritize the highest-value opportunities, and build a better weekly operating rhythm.