Know Your Restaurant's Financial Health Before Month-End
Your P&L tells you what happened. Foodi shows you where you're headed — while there's still time to act.
Foodi helps restaurant owners and operators monitor sales, food, labor, operating expenses and profitability throughout the month so they can identify problems early and protect their margins.
No software replacement. No long-term commitment.
August 2027 — Month to Date
By the Time You Get Your P&L, It's Already Too Late.
Most restaurant owners don't have a numbers problem. They have a timing problem.
- The labor has already been worked.
- The food has already been purchased.
- The sales opportunity has already passed.
- Cost problems have already affected your margin.
Your P&L is important. But it is backward-looking. Restaurant operators need a way to see what is happening now.
“What happened?”
Arrives days or weeks after the month closes. Accurate, necessary — and too late to change the result.
“Where are we headed?”
Sales, food, labor, prime cost and operating expenses tracked through the month against your targets — with the dollars each variance is costing you, while you can still act on it.
The Foodi Business Health Tracker
Foodi's Business Health Tracker brings the numbers that matter most into one operating view. It's the system we use to analyze your restaurant's financial health every week — so nothing important hides until the P&L arrives.
Here's what it helps Foodi monitor:
The numbers are only the start. Foodi translates them into dollar impact and where to act.
Percentages, translated into dollars.
A demo view of a fictional restaurant, mid-month. Every variance carries the dollar impact it's having on the month you're still operating in.
Month to Date — Demo Restaurant
Where to Focus
- Food Cost$2,997 unfavorable
- Labor$3,138 unfavorable
- Operating Expenses$1,995 unfavorable
One score. Every important operating signal.
Foodi brings the most important restaurant performance indicators into one operating view—so owners and operators can quickly see where attention is needed.
August 2027 — Month to Date
Budget vs. Actual
| Category | Budget | Actual | % of Sales | Variance | vs Budget |
|---|---|---|---|---|---|
| Sales | $185,000 | $178,400 | 100.0% | -$6,600 | -3.6% |
Prime Cost | |||||
| Food Cost | $53,650 | $56,890 | 31.9% | +$3,240 | +6.0% |
| Beverage Cost | $9,250 | $8,920 | 5.0% | -$330 | -3.6% |
| Labor | $59,200 | $61,780 | 34.6% | +$2,580 | +4.4% |
| = Prime Cost | $122,100 | $127,590 | 71.5% | +$5,490 | +4.5% |
Other Operating Costs | |||||
| Rent | $14,000 | $14,000 | 7.8% | $0 | 0.0% |
| Insurance | $2,100 | $2,100 | 1.2% | $0 | 0.0% |
| Software / Subscriptions | $850 | $920 | 0.5% | +$70 | +8.2% |
| Foodi Ops | $2,000 | $2,000 | 1.1% | $0 | 0.0% |
| Maintenance | $2,200 | $3,650 | 2.0% | +$1,450 | +65.9% |
| Misc. Purchases | $1,500 | $2,100 | 1.2% | +$600 | +40.0% |
Condensed P&L (Actual)
- 1
Food cost ran 2.9 points over budget this month, consistent with the vendor pricing trend flagged in last month's report. This is the leading driver of the prime cost overage.
- 2
Labor came in 2.6 points over budget. Scheduling wasn't adjusted for the softer-than-projected sales month, so labor as a percent of actual sales moved further from target than the dollar variance alone shows.
- 3
Maintenance is the single largest variance this month (+65.9%), tied to an unplanned equipment repair. Should self-correct next month — worth confirming it isn't a recurring issue.
- 4
Prime cost at 71.5% is above the healthy 55-60% range. Net profit is still positive at 14.6%, but this is the number to watch: if food and labor variances repeat without a sales rebound, margin compresses quickly from here.
Don't Just Track Your Numbers. Know What They Mean.
Know where sales, food, labor and operating expenses stand right now.
See which variances are affecting your profitability and how much they are costing you.
Identify the areas that deserve attention before the month closes.
“Here are your numbers.”
“Here's what your numbers mean, why they changed, what they're costing you, and what you should do next.”
Find Out What's Really Happening in Your Restaurant
Foodi Restaurant Business Health Assessment
We'll take your existing restaurant numbers and build a customized financial health picture for your business.
- No long-term contract.
- No accounting-system replacement.
- No complicated software.
- Review of your recent financial performance
- Business Health Tracker configuration
- Key target-setting
- Food & labor analysis
- Prime-cost analysis
- Operating expense review
- Month-end performance projection
- Your 3 biggest profit opportunities
- Variances translated into dollars
- 60-minute owner review
Built for Restaurant Operators
The Business Health Assessment is designed for restaurant owners and operators who:
After Your Assessment, You'll Know:
Where am I financially right now?
Where am I likely to finish the month?
Which costs are hurting me the most?
How much are those problems costing me?
What should I be watching every week?
What are my three biggest opportunities to improve profitability?
There's no login. There's a person.
Foodi isn't another software subscription. We don't ask you to replace the systems you already use, and we don't expect you to spend your day staring at another dashboard.
Foodi works inside your business every week.
Your data comes from whatever you already use — Toast, Craftable, Restaurant365, spreadsheets, accounting systems — and we turn it into something you can actually act on.
- We look at what moved.
- We figure out why.
- We identify what it's costing you.
- And we tell you what deserves your attention.
Then we do it again next week.
Software gives you numbers.
We give you context.
Your labor might be 2% higher than target. But why?
Maybe your manager added another server to Tuesday's schedule. Maybe sales didn't support the hours. Maybe overtime crept in. Maybe your sales mix changed.
The number tells you what happened. Experience tells you why. And knowing why is what allows you to fix it.
You're not buying another tool. You're gaining a partner who knows your numbers as well as you know your kitchen.

Restaurant Operations Experience. Not Just Spreadsheet Experience.
Marco Coleman spent 18+ years inside restaurants — from the line to Executive Chef to Director of Operations — and has operated with Craftable for 8 years. He built Foodi's methodology out of what actually worked on the floor, not out of theory.
Eight years operating in Craftable, across everything from single-unit implementations to multi-location rollouts — which is why Foodi can get a team live on it in days rather than months.
When you work with Foodi, you're working with Marco. Not a rotating account rep, not a dashboard login with a support inbox. The same person who built the methodology is the one reading your numbers every week and telling you what they mean.
The recurring work that catches problems while they're still small.
Monthly P&Ls tell you what already happened. Foodi's weekly rhythm tells you what's happening now — while you can still do something about it.
Waste
Track spoilage, prep loss, and over-production. Waste is the leak operators feel but rarely measure — we put a dollar figure on it every week.
Purchasing
Vendor price changes, invoice errors, and off-contract buying get caught the week they happen, not at year-end. A quiet 4% increase on your top protein is worth thousands before anyone notices.
Budget vs. Actual
Your targets, measured weekly against real performance. You know you're off pace in week two — not when the month closes and it's already gone.
Forecasting
Sales forecast against prior-year performance, so labor and ordering are built on what actually happens in your restaurant — not a guess. Better forecasts mean tighter schedules and less over-buying.
A better operating rhythm for your restaurant.
Establish Your Baseline
Foodi learns your restaurant's economics, targets, food and beverage recipes, cocktail specs, vendors, labor structure, and operating model. If you're not on an operating platform yet — or you want to switch — we handle the Craftable implementation and train your team ourselves. Implementation is never the barrier to getting started.
Monitor What Matters
Foodi continuously looks for meaningful changes, variances, and opportunities.
Take Action Every Week
Your team knows what needs attention, why it matters, and what the financial opportunity is.
Use what you have. Or use what we'd pick.
Foodi is not a software company and we don't sell licenses. We work inside the back-of-house platform you already run — Craftable, Restaurant365, MarketMan, Toast, or spreadsheets, if that's where you are today. The analysis doesn't change based on the logo on your dashboard.
But operators ask us what we'd use. So here's the honest answer.
We recommend Craftable — and here's why it's not about features.
Most back-of-house systems can do the job on paper. They fail for the same reason: your managers stop using them. A platform that takes three weeks to train and a manual to navigate gets abandoned by week five, and you're back to guessing. The best system is the one your team will actually open on a Tuesday morning.
Craftable is the one we've seen managers adopt and keep. The interface is clean, the training curve is short, and a GM who's never run inventory software can be running it confidently in days, not months. Marco has operated with Craftable for eight years and has led implementations from single restaurants to multi-location groups — so if you choose it, setup, recipe costing, vendor integration, and manager training are handled. Implementation is never the barrier to getting started.
Already on something else? Nothing changes.
If you're running Restaurant365, MarketMan, or a POS-native inventory tool and it's working, keep it. Foodi layers on top of the data you already produce. We'll tell you honestly if we think your platform is limiting what you can see — and we'll tell you just as honestly when it isn't.
You choose the platform. We're the partner either way.
Already have a platform
Foodi works inside it. No migration, no new licenses, no disruption to your team's routine.
Choosing one now
We'll walk you through the trade-offs and give you a straight recommendation — Craftable is usually it, and we'll tell you why.
Starting from scratch
Full Craftable implementation: setup, recipe costing, vendor integration, and hands-on manager training until your team owns it.
Foodi is an independent consulting practice and a referral partner of Craftable. We don't resell software licenses, and our recommendation is based on eight years of hands-on operating experience with the platform.
The items no one is watching.
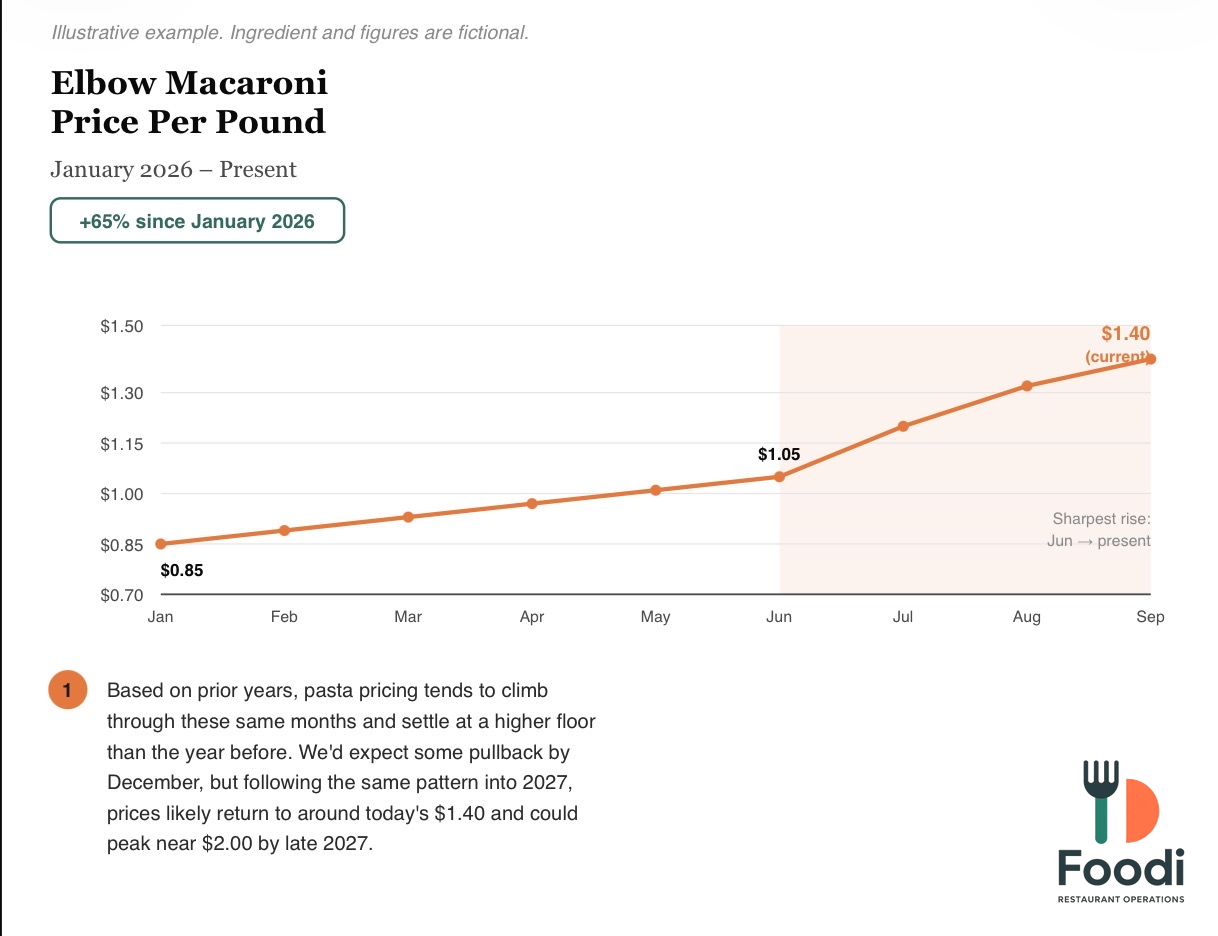
Most restaurants track the big categories. Foodi tracks the ingredient that's quietly climbing 65% while nobody's looking — and tells you what to do about it before it shows up on your P&L.
1. We track the trend, not just the invoice
One ingredient climbed 65% in nine months without a single alarming invoice.
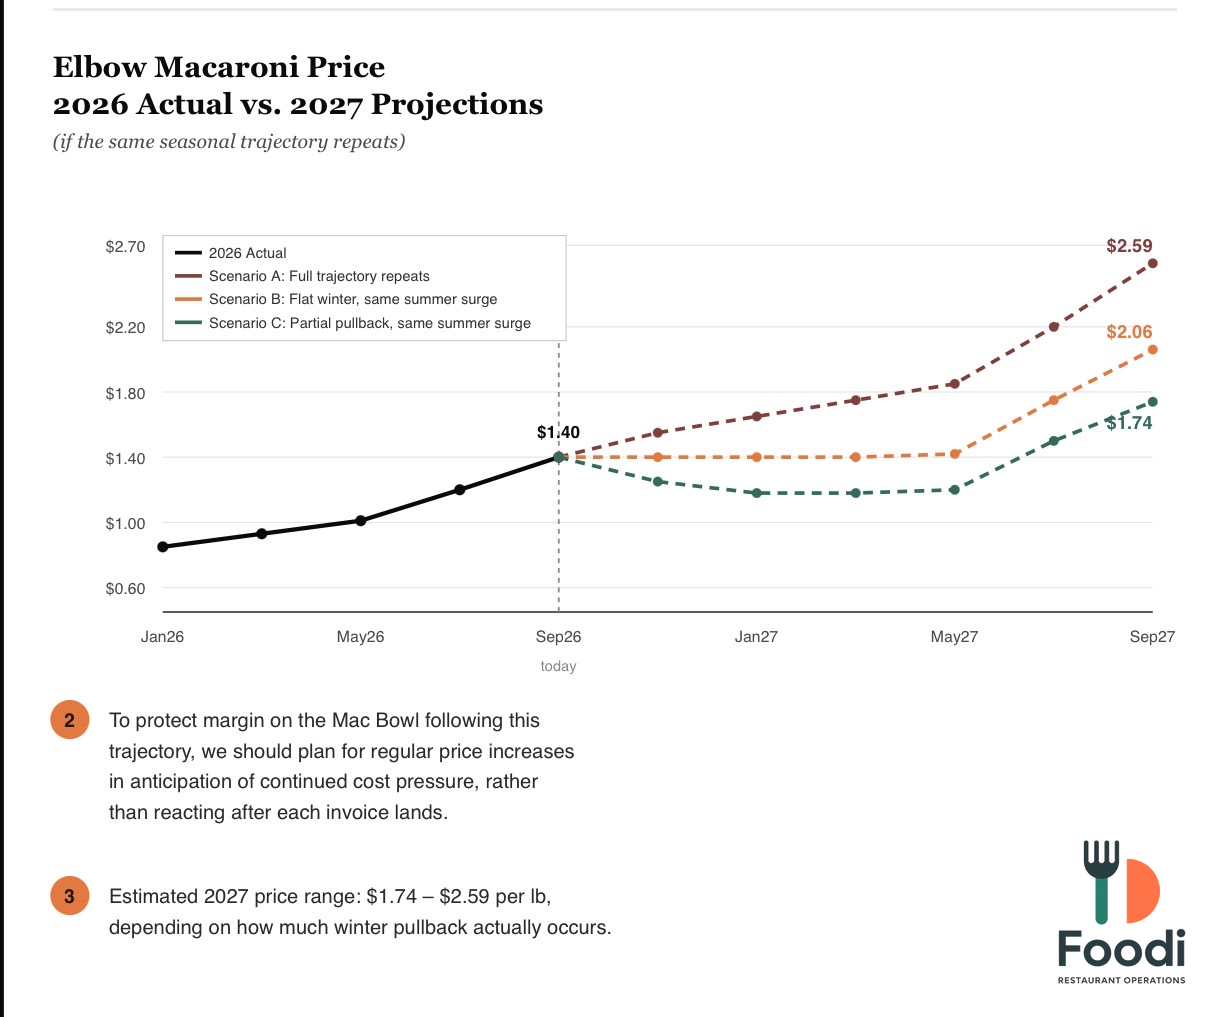
2. We project where it's headed
We model the likely range ahead so pricing decisions happen early, not late.
3. We show what it costs your menu
The same trend, translated into monthly profit on the dish that uses it.
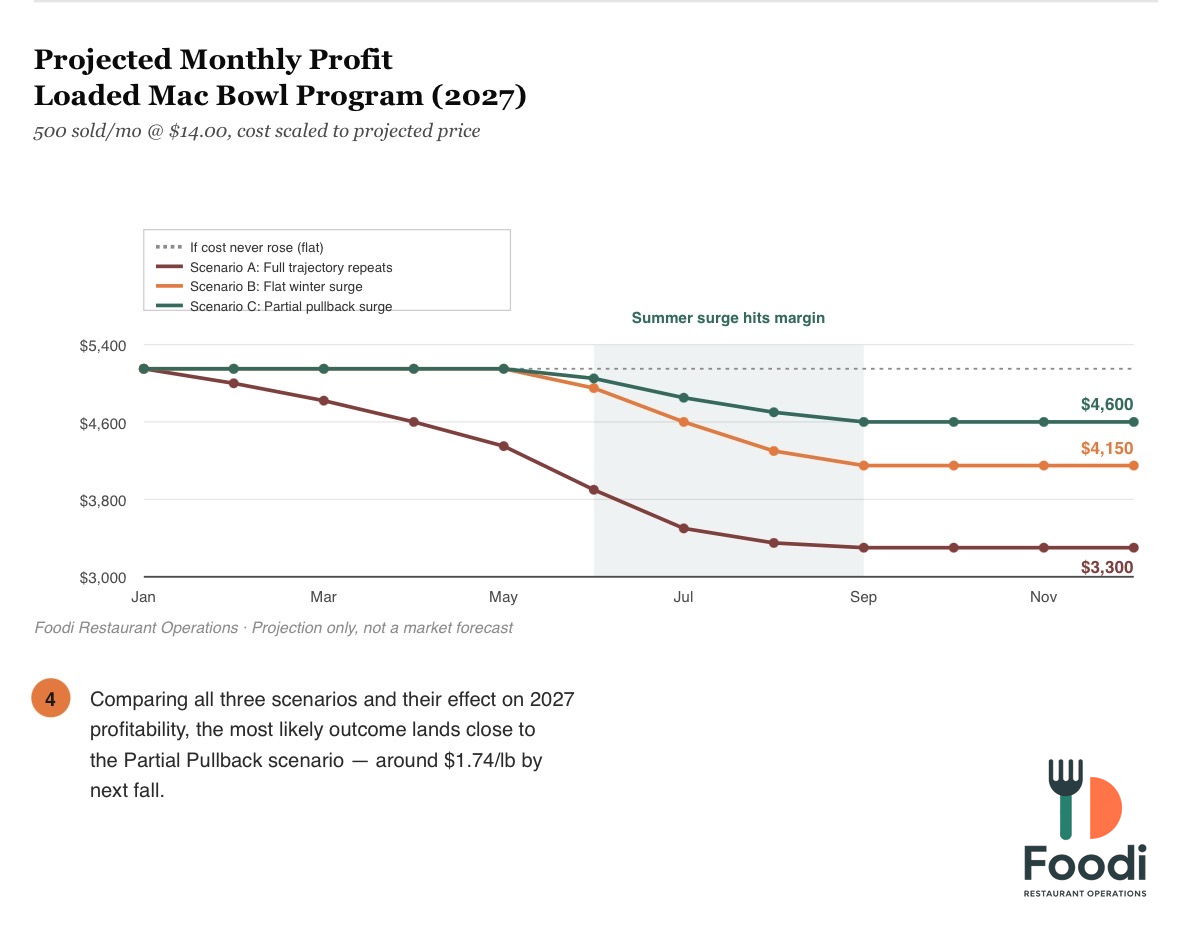
Ingredient and figures shown are illustrative examples for demonstration purposes.
One operating system for every location.
As you add locations, complexity grows faster than headcount. The moment you have a second restaurant, Foodi's cross-location scorecards, benchmarking, and group health score turn on automatically — no upgrade, no new plan. Comparing locations is the entire point of running more than one.
Group Roll-Up — Month to Date
- Location 0194
- Location 0291
- Location 0387
- Location 0482
- Location 0571
We don't drop off a report and leave.
Most consultants deliver a binder, shake your hand, and disappear. Ninety days later nothing has changed, because a report isn't a system and a system isn't a habit.
Foodi is built the opposite way. We stay.
Your costs move every week. Vendors raise prices. Your menu mix shifts with the season. Your best manager leaves and takes their habits with them. The profit opportunity in your restaurant is not a fixed number you find once — it's a moving target, and finding it is ongoing work.
That's the relationship. Every week we're looking at your numbers, telling your team what changed, what it cost you, and what to do about it. Every month we're reviewing what moved and what's next. As you grow, the system grows with you.
You're not buying a report. You're gaining a partner in your success.
We stay in it with you
Weekly analysis, not an annual audit. We catch problems while they're still small and cheap to fix.
Your team owns the system
We train your managers to run the daily systems themselves — so the discipline stays even when we're not in the room.
We grow with your business
Start with one location and a free audit. Scale to a full multi-unit operating system. Same partner throughout.
Need More Than Visibility?
Once we identify where the money is going, Foodi can help you fix it. The Business Health Assessment is the first step; ongoing consulting is the work that follows.
Explore Foodi ConsultingFind the profit hiding inside your operation.
Foodi looks beyond the headline numbers to uncover the operational causes behind them.
Food & Beverage Cost Leakage
Identify purchasing, recipe, portion, pour cost, waste, and pricing issues across food and bar.
Labor Leakage
Find locations, shifts, or scheduling patterns creating unnecessary labor cost.
Vendor Opportunities
Identify price increases, purchasing inconsistencies, and consolidation opportunities.
Menu & Cocktail Opportunities
See which menu items, cocktails, and beverages generate margin—and which ones need attention.
Location Performance
Compare locations and identify outliers before they become expensive problems.
Beverage & Pour Cost
Roughly one in five ounces of alcohol never reaches a paying guest. Find over-pouring, spill, comps, and invoicing errors before they show up as a three-point miss on your pour cost.
Operating Discipline
Create consistent weekly accountability across your management team.
Foodi isn't another expense. It's an investment in operating margin.
Restaurants operate on tight margins. Small improvements in food and beverage cost, labor, purchasing, bar programs, pricing, and operating discipline can create meaningful financial impact.
Illustrative example. Not a guaranteed result.
The goal isn't more reports. The goal is more profit.
Stop Waiting for the P&L to Tell You What Happened.
Know your numbers. See the warning signs. Take action while it still matters.